Analysis
Table of contents
Quality Control
Selecting a analysis pipeline
Job Monitoring
Quality Control
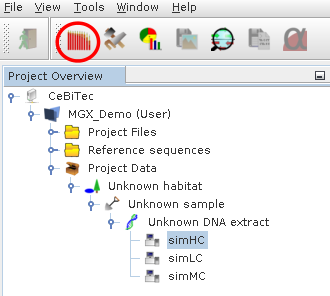
Select a sequencing run object, the Quality Control component can be opened from its menubar icon (red circle).
Quality control reports generated within MGX should be inspected before proceding with data analysis.
MGX currently offers three types of QC reports:
- Distribution of GC content
- sequence length
- nucleotide distribution within the DNA sequences
Those can be used to evaluate overall sequence data quality and check for possible signs of contamination.
Examples
GC distribution of a public metagenome dataset (SRR3569370).
Nucleotide distribution of the public metagenome dataset (SRR3569370).
The chart displays the distribution of nucleotides within the first 100 bp.
Read length distribution of the public metagenome dataset (SRR3569370).
Here the sequencing data was imported without prior quality trimming.


Depending on the kind of sequence data, different patterns may emerge, which might or might not warrant any further action.
While small amounts of e.g. adapter residue are sometimes encountered and might be considered acceptable, it is up to the individual researcher to check back with their sequencing provider and ask for adapter sequences to execute additional trimming.
Selecting an analysis pipeline
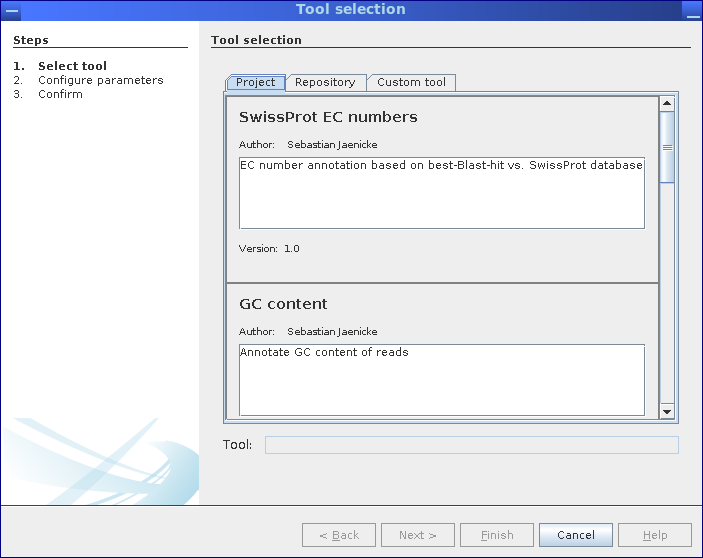
Step 1: Select analysis pipelines.
Analysis pipelines can be selected from the corresponding MGX project itself, from the repository of public pipelines provided by the server, or, a custom workflow can be uploaded and executed.
All analysis pipelines can be started from the context menu of the metagenome dataset to be analyzed, provided the user has been granted at least User level access. First, the user can choose the desired pipeline from the project itself, from the pipeline repository hosted on the MGX server, or upload an own pipeline implementation.
Subsequently, analysis parameters can be reviewed and adapted before submitting an analysis.
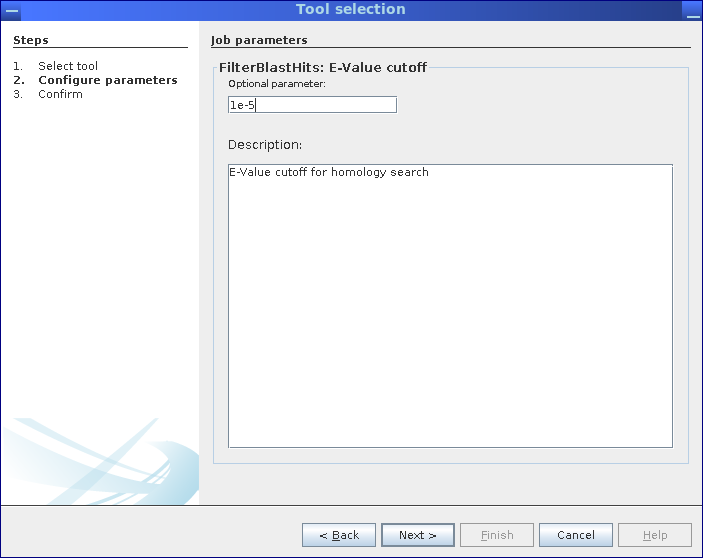
Step 2: Inspect and adapt parameters for the selected pipeline. The actual number of steps depends on the number of parameters available for customization.
Step 3: Before execution, a final overview of all parameters is shown. Once confirmed, the pipeline is submitted and scheduled for execution on the MGX server.
Here, the selected pipeline has only one single parameter.
Monitoring job progress
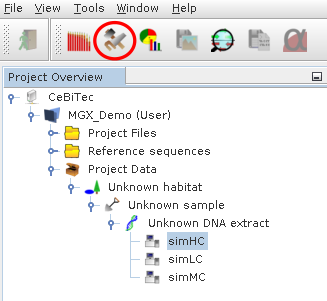
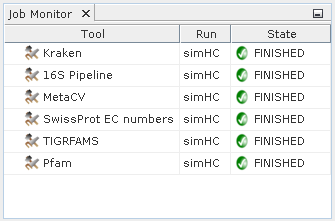
The Job Monitor component is provided to inspect the state of jobs present within a MGX project. It can be opened from the toolbar and will display the state of jobs scheduled for execution, currently running or already finished.
The Job Monitor component can be opened using its icon in the toolbar.
The Job Monitor provides an overview of job states. Depending on context, all jobs within a MGX project or only jobs for a single dataset will be displayed.
In addition, it can also be used to delete jobs and corresponding analysis results when no longer needed. Depending on the selected item in the Project Explorer, the Job Monitor will by default display all jobs within a project; if a single sequencing run is selected, only jobs for this dataset will be shown.

