Visualization
Table of contents
Result visualization
Exporting sequences
Biodiversity indices
Displaying reference mappings
Result visualization
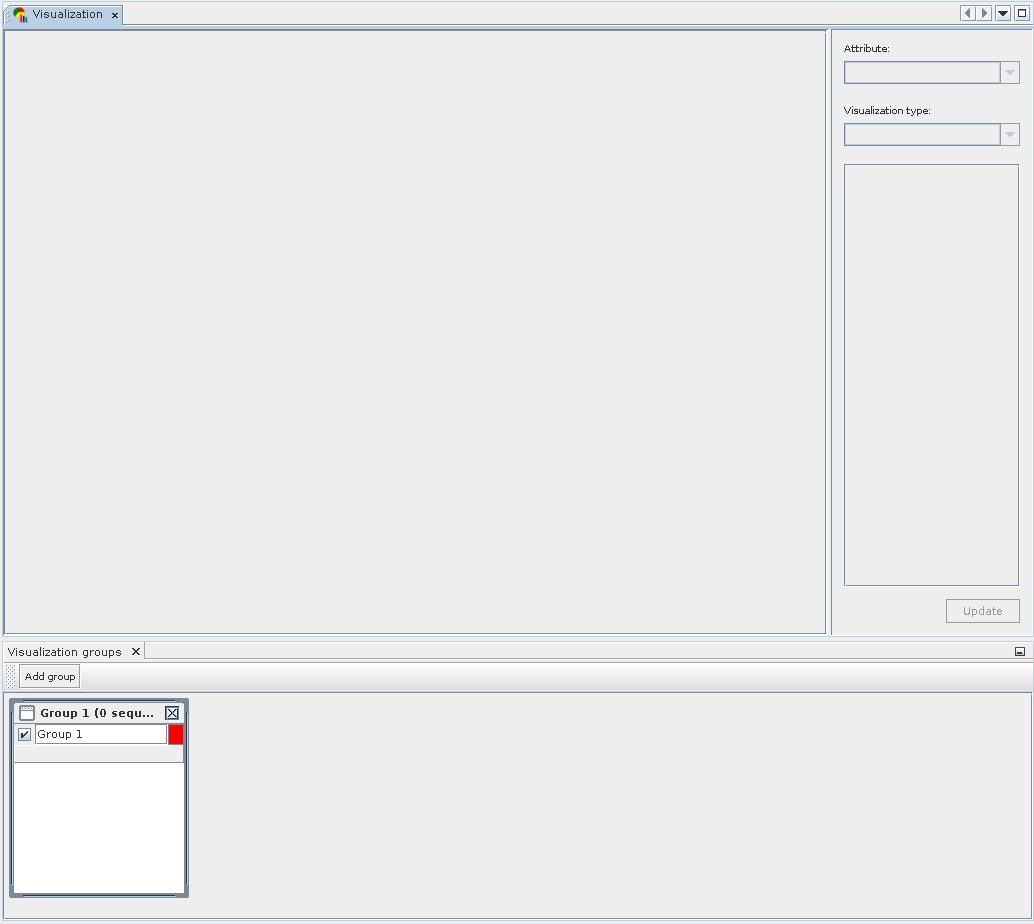
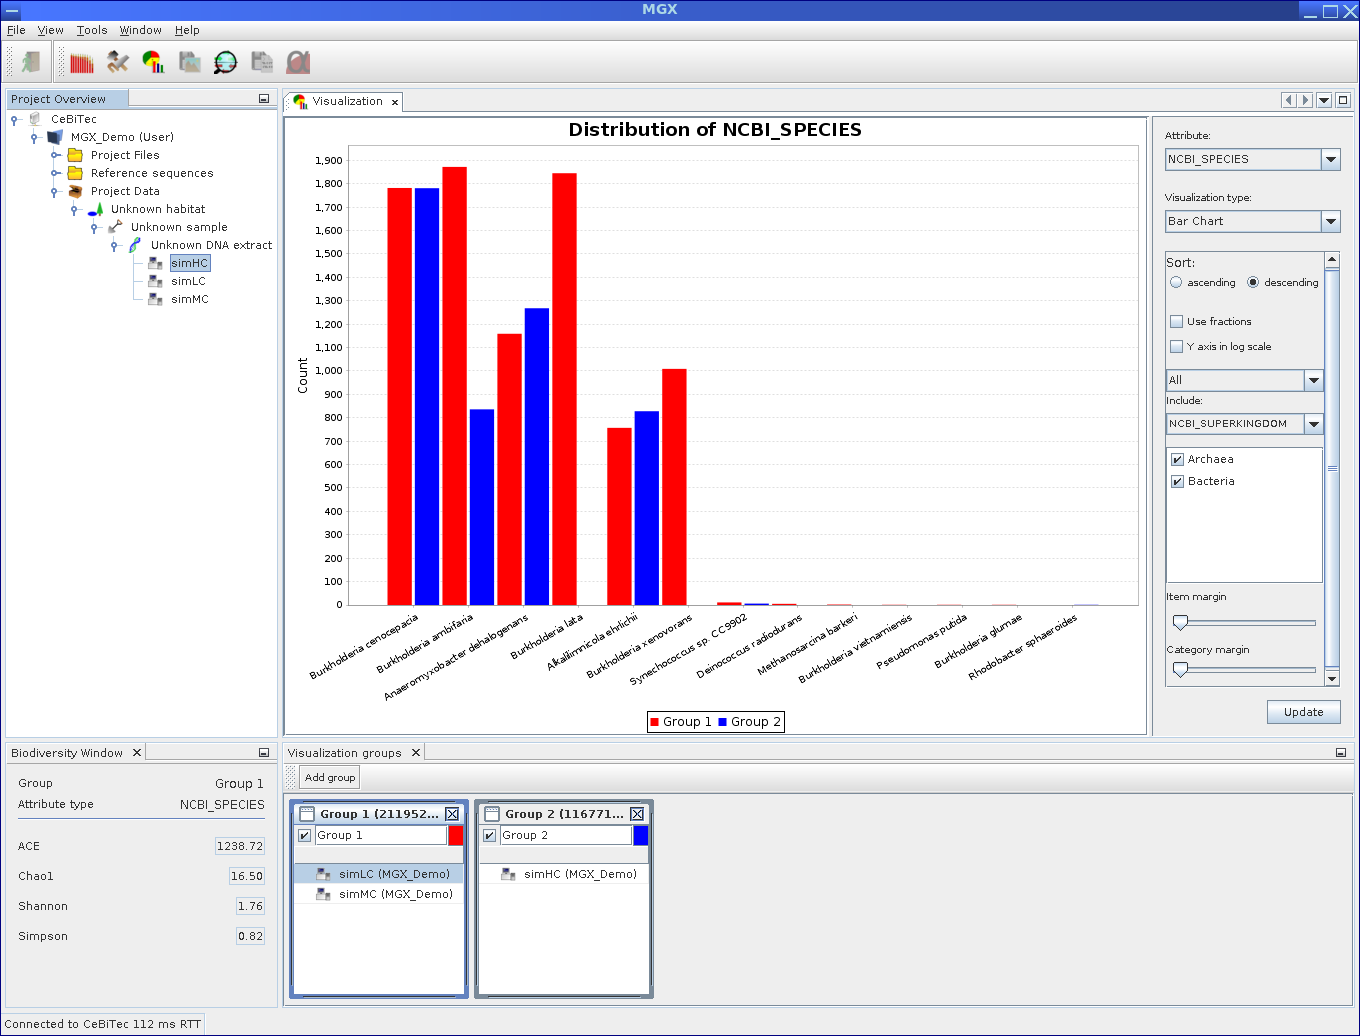
The Visualization component actually consists of two separate windows. The Group Window is located at the bottom and used to create, name and define groups used for data display. Sequencing runs can be added to individual groups using Drag and Drop.
While any sequencing run can be present in several groups simultaneously, it is impossible to add it to a group more than once. Groups may be assigned a name, the user can choose their display color, and they may be temporarily excluded from display.
The main visualization window is shown at the top; once sequencing runs are added or changed, the type of analysis result can be chosen on the top right. Afterward, the desired visualization type is selected and may be customized.
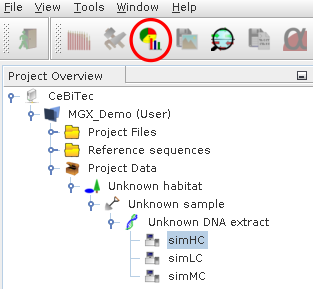
Start: Click Icon for the Visualization module.
Composition of Visulization: Components of the Visualization module. The bottom window is used to create and define groups, while the top window allows to select result and visualization type, customize options and display the final chart.
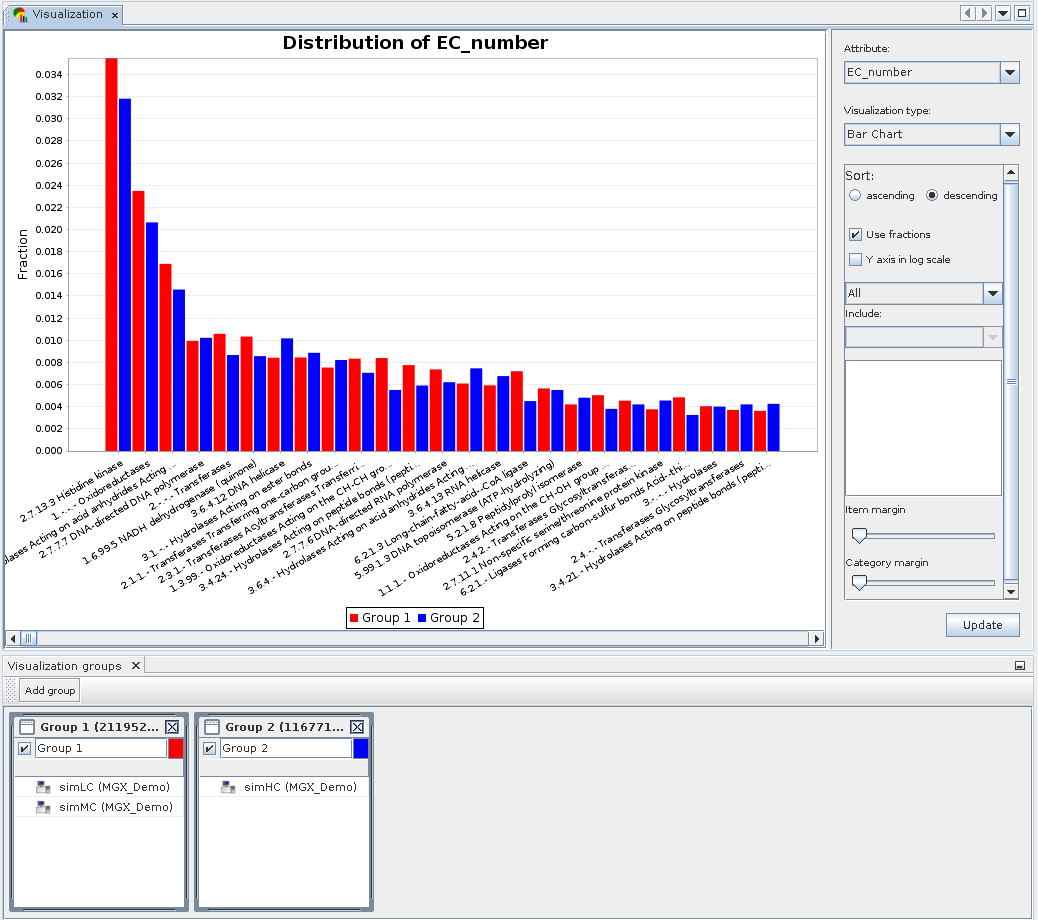
Visualization example: Displaying a bar chart for two groups.
Two groups were defined containing the simLC and simMC metagenomes in the first and the simHC metagenome in the second group. The main visualization window shows a bar chart generated for these groups based on assigned EC numbers. To account for differences in dataset size, both groups are normalized to fractions.
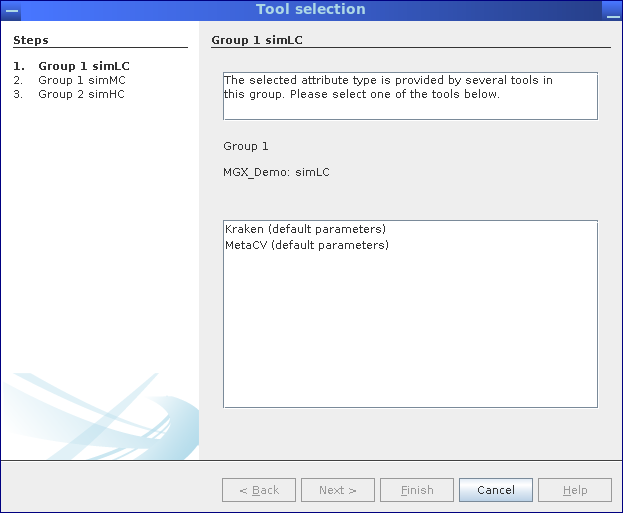
In case a result is provided by multiple jobs, e.g., different taxonomic assignment methods, a dialog allows one to select between jobs. In this example, taxonomic assignments are supplied by MGX pipelines employing Kraken Wood and Salzberg, 2014 as well as MetaCV Liu et al., 2012.
Whenever more than one analysis job provides a selected result type, an interactive dialog allows the user to review possible jobs and choose one.
This scenario will occur when a tool is executed several times with different parameters or when different taxonomic classifiers are used to analyze a dataset.
Exporting sequences
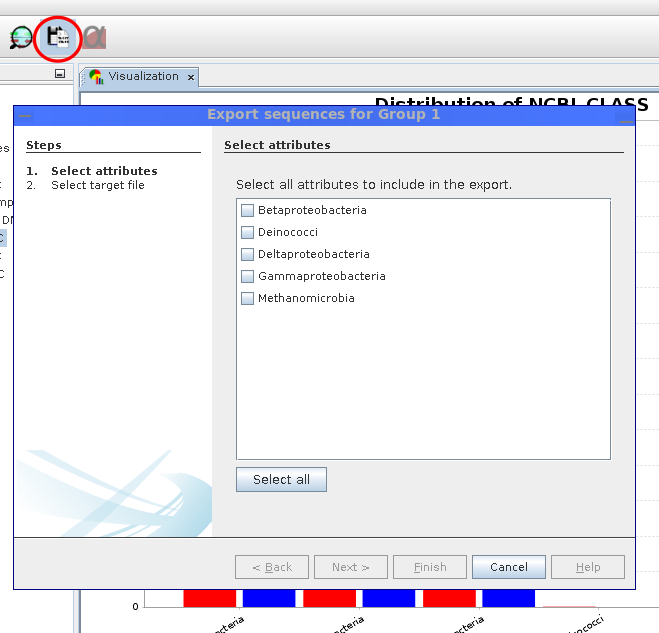
Sequences can be exported for each group individually. The user can freely choose which attributes should be included.
The Sequence Export wizard allows the export of sequences conditionally based on analysis results. For each visualization group, it is possible to choose the attributes for which sequences should be obtained. Sequences are downloaded from the MGX server and saved in FASTA format files for each group.
Start: Click icon (red circle) at menu.
Biodiversity indices
The Visualization module features another component used to display commonly used biodiversity indices, such as the ACE, Shannon Spellerberg and Fedor, 2003, Chao1 Hughes et al., 2002, and Simpson Simpson, 1949 indices. The component will automatically show the index values for the currently selected visualization group based on the chosen attribute type.
Example: Biodiversity indices (bottom left) such as ACE or Shannon are computed for the currently selected visualization group.
Displaying reference mappings
Aligning metagenome or metatranscriptome data to reference sequences of known origin allows researchers to evaluate the relative identity between metagenome sequences and the actual strain or to obtain an overview of gene expression within a metatranscriptome. MGX currently provides predefined pipelines employing BLAST Altschul et al., 1990, FR-HIT Niu et al., 2011, and Bowtie 2 Langmead and Salzberg, 2012.
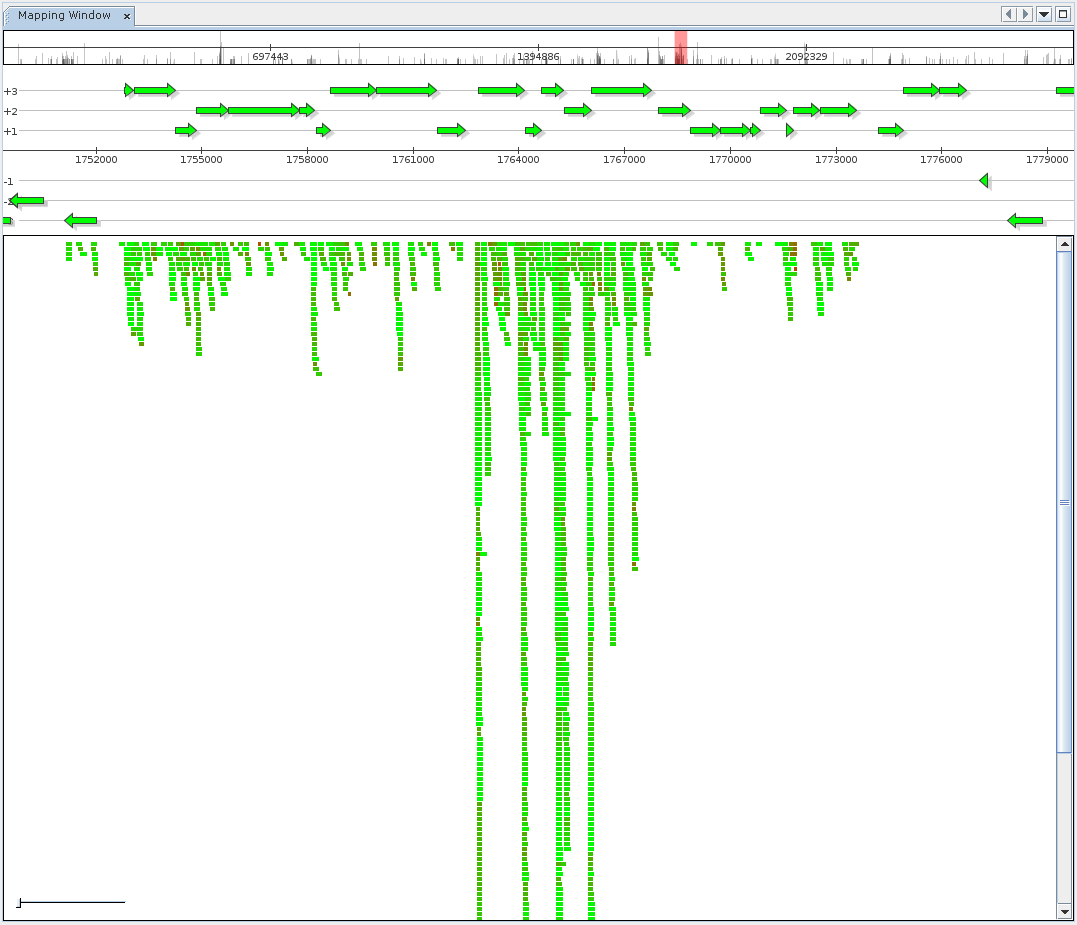
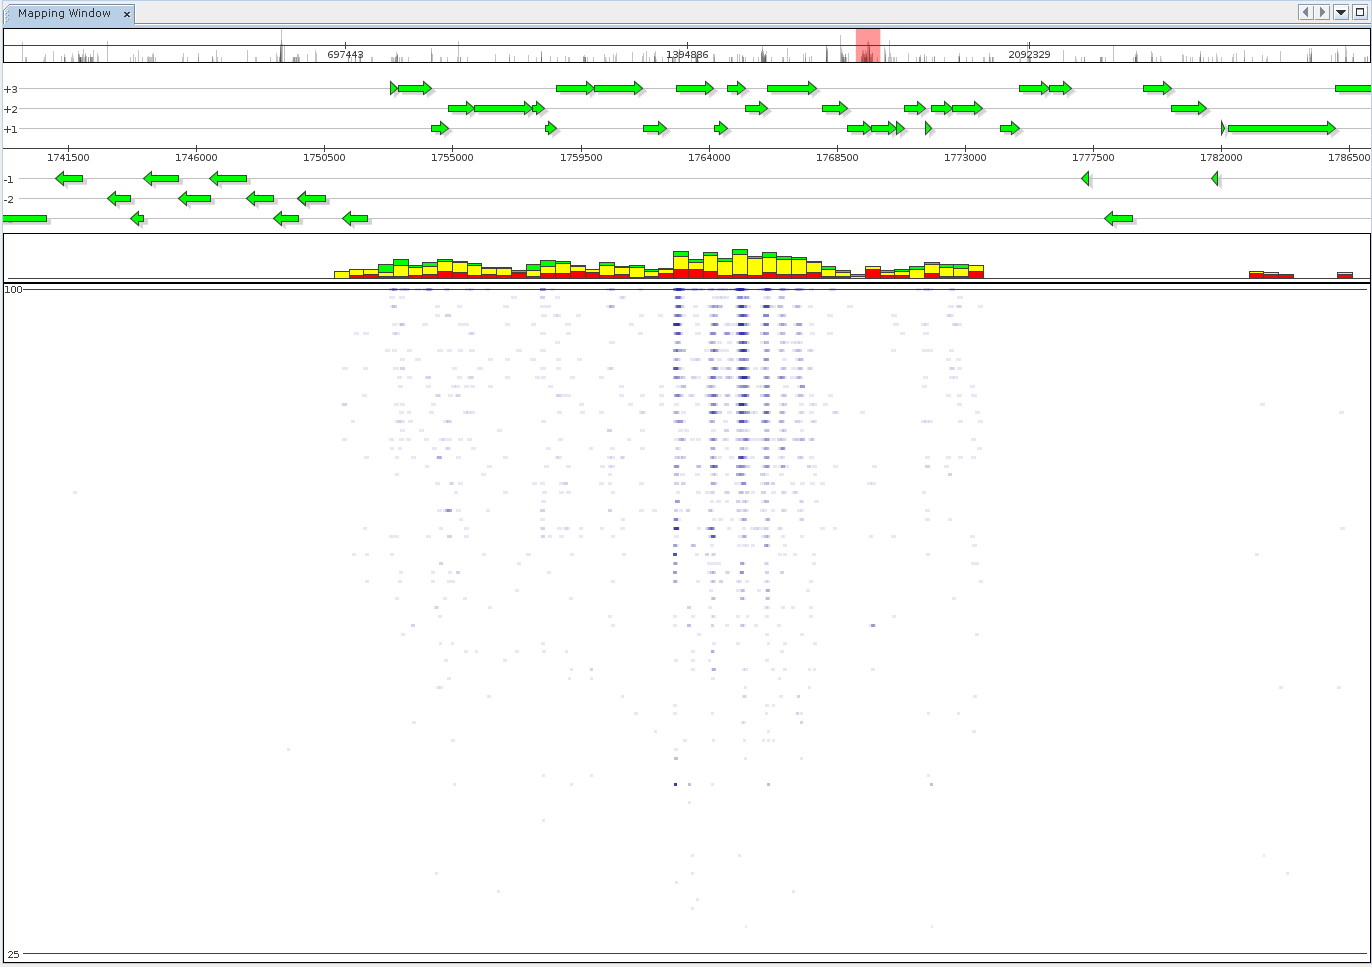
The reference Mapping component is provided to inspect and browse alignment results, offering both a generic alignment view where each mapped sequence is colored according to mapping identity as well as a fragment recruitment view. Switching between view modes is possible from the context menu of the Mapping component.
The reference mapping component shows alignment results for a metatranscriptome dataset mapped to the reference genome of one of the dominant organisms.
From top to bottom, the component displays:
- Navigation and coverage histogram
- The currently selected interval
- Aligned DNA sequences for the interval
Color coding refers to relative sequence identity.
An alternate visualization mode is the generation of fragment recruitment plots, showing the same data as above. The view mode features the fragment recruitment plot itself. Additionally, it provides stacked bars summarizing mapping identity within reference intervals, grouped into low (red), medium (yellow, 75%), and high (green, 97%) quality mappings.

